<Visual Revelation>--Reading Note (2)
Visual Revelations – Reading Notes(2)
CHAPTER 2 Graphical Mysetires
The greatset value of a picture is when it forces us to notice what we has been never expected to see. –John Turkey
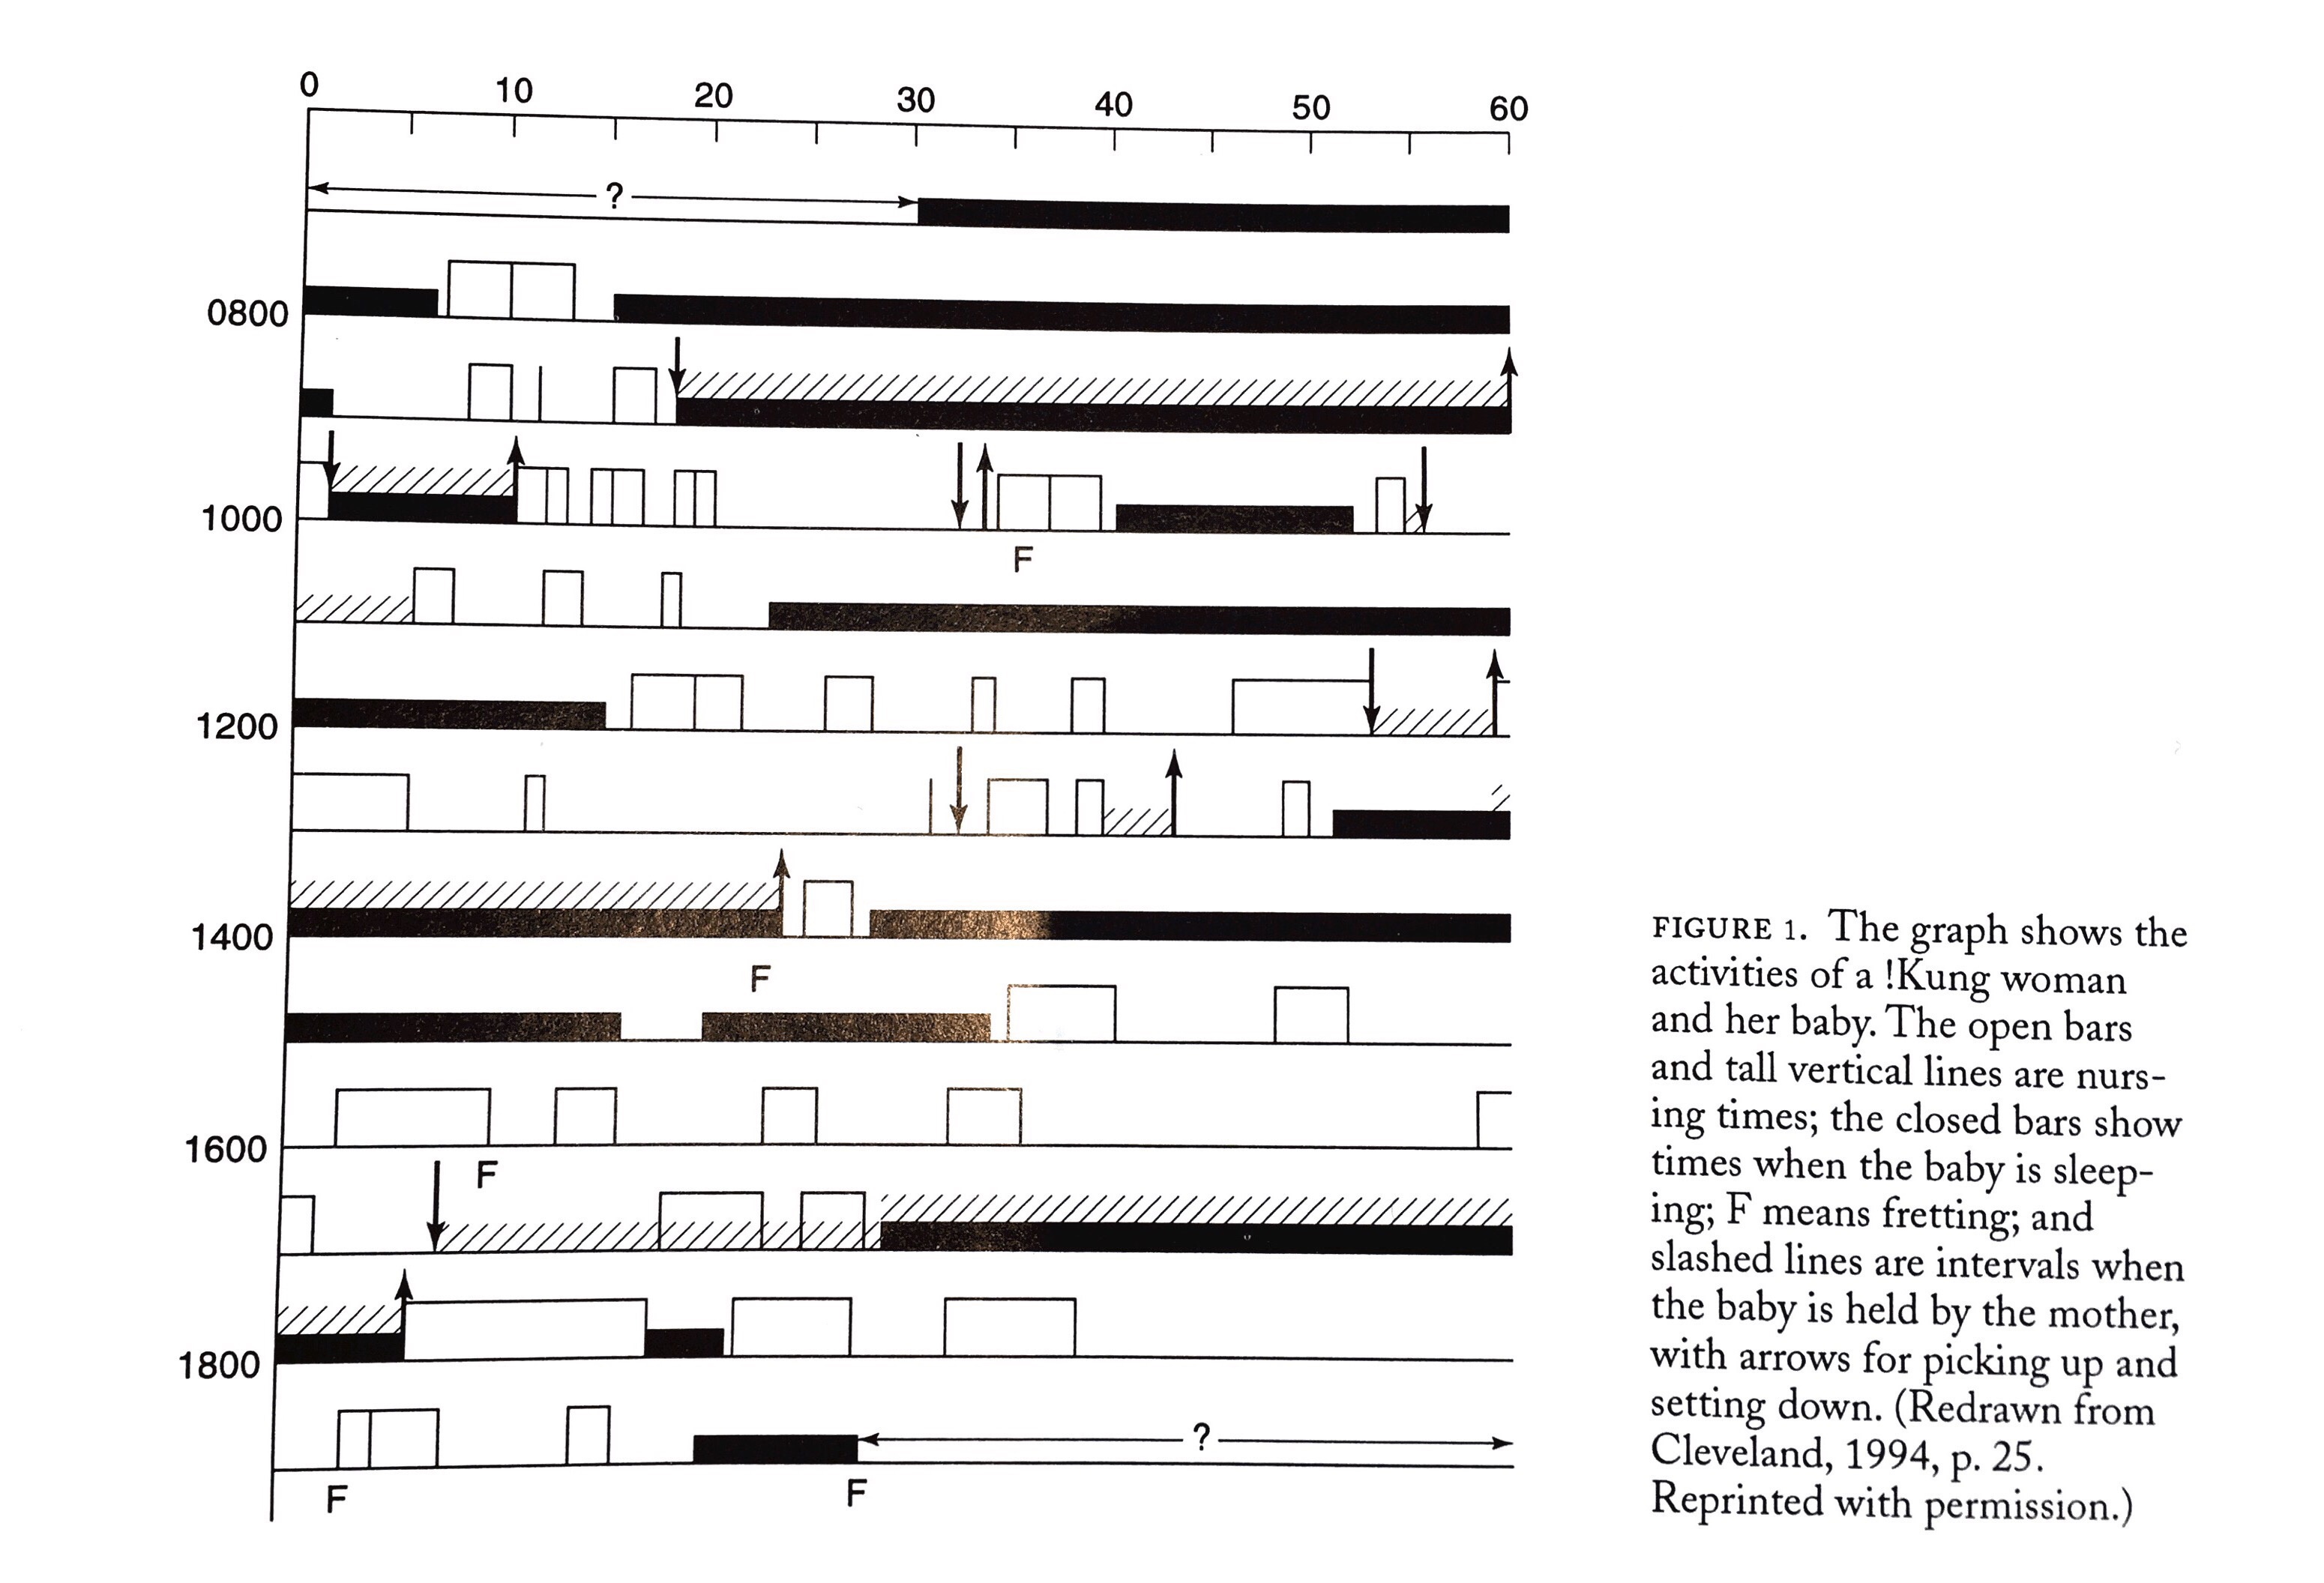
Mystery #1: Pregnancires Among !Kung Women
Confusing because:
- Using different symbols to represent different events on a common time scale. Irrelevant events have at least as much visual weight as the theortically important ones.
- Understanding the graph requires memorizing a complex legend and ignoring everything superfluous.
Key:
Use a common metaphor for all the activities.

